Some thoughts on the Use and Transparency of 3D Recordings in Digital Humanities

by Pieter-Jan De Vos, Erfgoed Leiden en Omstreken
The Pure3D project aims at designing an infrastructure for the publication and preservation of 3D Scholarship (including 3D worlds and objects). Rather than being a mere visualisation platform, the infrastructure puts a great emphasis on including textual and multimedia annotations that communicate context and decision making (paradata) [https://pure3d.eu/]. The inclusion of such information will enhance what the London Charter understands as “intellectual transparency”, i.e. the provision of information to allow users to understand the nature and scope of “knowledge claim” (London Charter).
In the previous blogpost “Some thoughts about integrating documentation, modelling and publication for historical 3D models”, Tijm Lanouw of the 4D Research Lab, explored the possibilities for the transmittal of information in the creation of 3D worlds, reconstructing and modelling historical environments using 3D modelling software like Blender – aiming at maximising transparency in the modelling workflow [https://pure3d.eu/index.php/2021/10/26/4d-research-lab-blog-post/].
In this contribution I would like to explore the issue of intellectual transparency regarding 3D recordings of physical objects, i.e. 3D models that are products of optical sensing techniques such as laser scanning and/or image-based modelling.
That the reconstruction of 3D objects or worlds is an interpretative venture seems clear to most scholars and to some extent its consumers. At the base of the final visual outcome precedes heaps of decision making in at least the following categories: a.) archival research; b.) (building) archaeological research; c.) spatial analysis and d.) esthetical sensitivity conditioned by cultural conventions and technical possibilities. The recording of these discissions is fundamental since they give insight in the accuracy, precision and reliability of the visual reconstruction. After all a 3D reconstruction is an invention, at its best a well-argued interpretation.
When it comes to the creation of 3D models as recordings of existing physical objects, ideas are somewhat different. Often these models are advertised or considered to be digital replicas. Therefore, the fact that decision-making and interpretation influence the visual outcome is less recognised and under-acknowledged than it is with reconstructions. Just as with 3D reconstructions, communicating context and decision making that influenced the recording and processing of 3D models is essential if we want to disclose 3D data with scientific integrity. However, often end-users (historian, archaeologist, museologist, etc.) using optical sensing products are not aware enough of the complexity of data-acquisition processes and data processing – and this can lead to misconceptions or even misuse. I would like to address the following interrelated issues:
1. Surface dominance;
2. Technology as a black box
3. Direct vs indirect survey techniques
1. Surface dominance
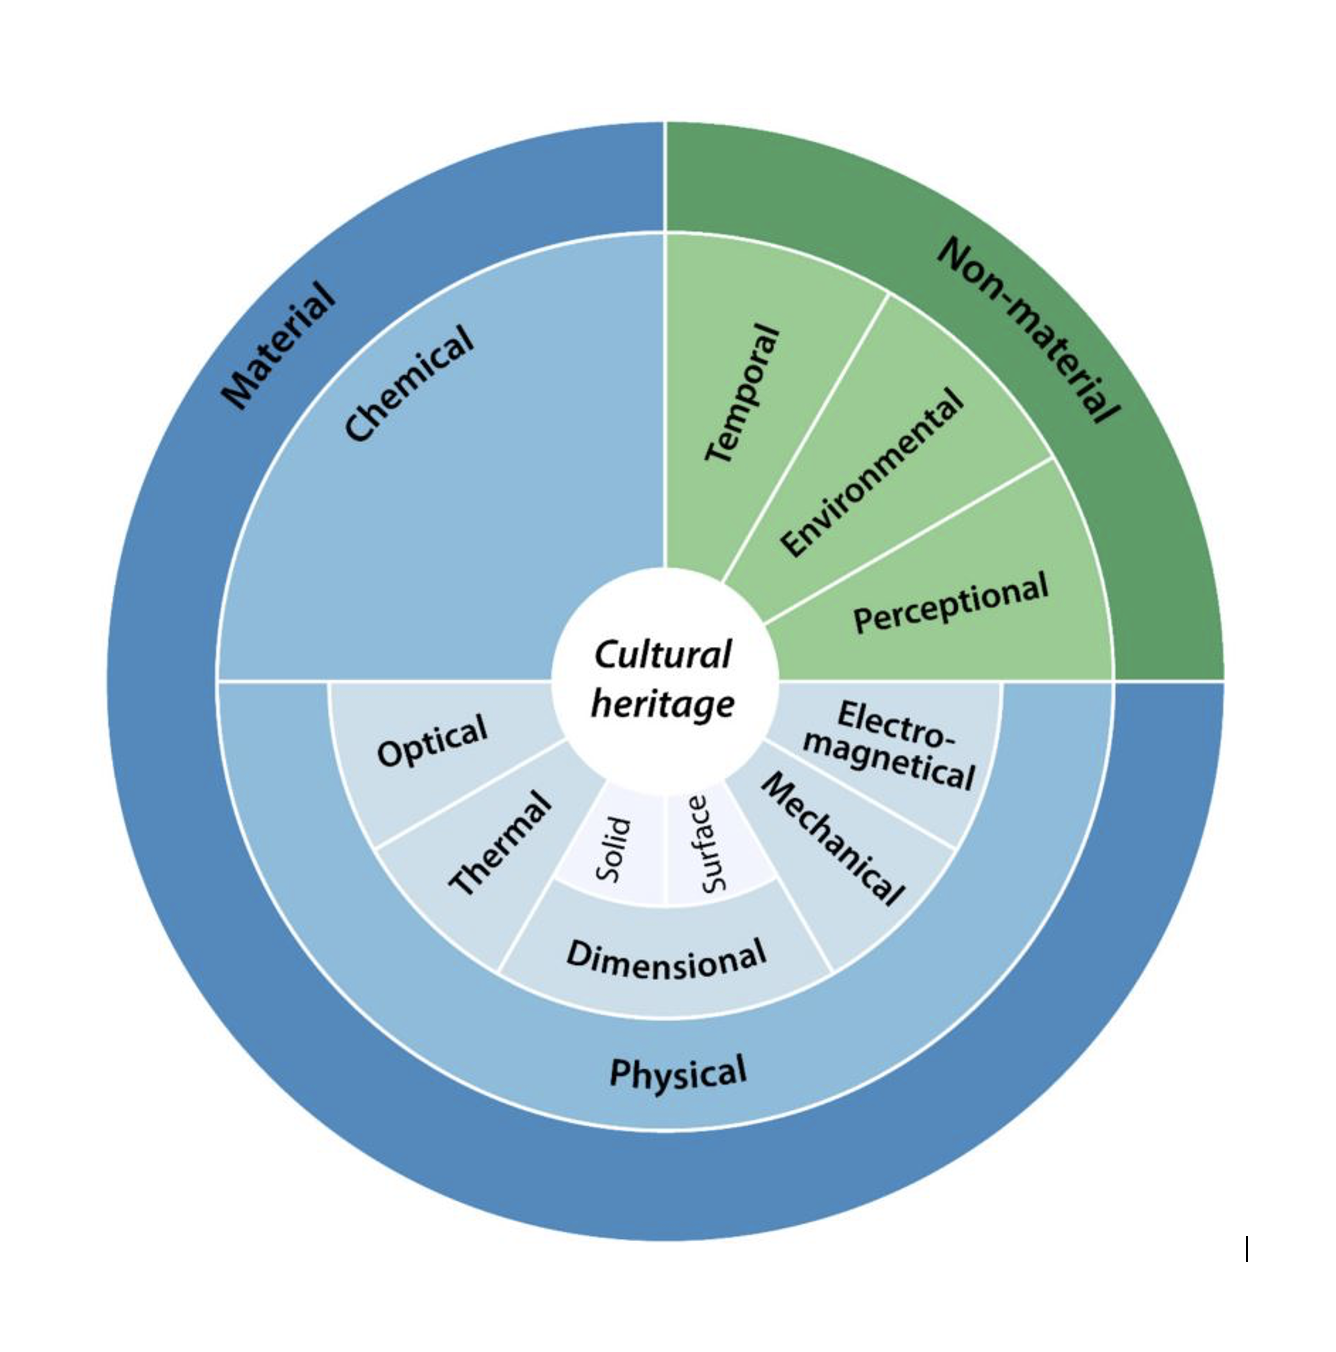
In the last two decades, extensive research and development in geospatial capture performance have resulted in that techniques such as imaged-based modelling (digital photogrammetry) and 3D laser scanning have become rapidly more accessible to the field of cultural heritage. The techniques, including equipment and software, have become affordable (at least cost-effective) and, because of a high degree of automatization, easy to use. Because data is captured in three dimensions and it is promised to be highly accurate and precise, the final products (3D models) are often advertised as 3D replicas or even as “digital twins” – a buzzword in most cases misused (e.g. https://www.floatscans.com/ [consulted 26.01.2022]). This contributes to the current 3D datafication wave in cultural heritage. It is fed by the assumption that the mere creation of digital surface models will allow scholars all over the world to study heritage in ways previously unheard of. Although partly correct, statements like these distract from the fact that digital 3D data only represent one of the many essential characters of a heritage asset (such as mass, building material, chemical quantities, etc.) [Verhoeven 2019]. As the pie chart below shows, this is only a small fragment of all heritage assets that a research or recording could include. The fact that the focus of most 3D recordings is very limited, means that the products cannot be considered as replicas but as visualisations – imitating objects not presenting them. Nevertheless, visualisations have an increasing impact on our research and in turn on giving meaning to heritage. It is therefore important for scholars to understand how these visualisations emerge.

This graph by Geert Verhoeven was shown during his 2019 keynote speech at the biannual CIPA Heritage Documentation symposium. The pie chart shows the different heritage assets that can be part of a research or recording. Mind that the represented chart is structural representation and does not reflect the importance of the various aspects on the way that value might be assigned to cultural heritage. (Verhoeven 2019).
2. Technology as a black box
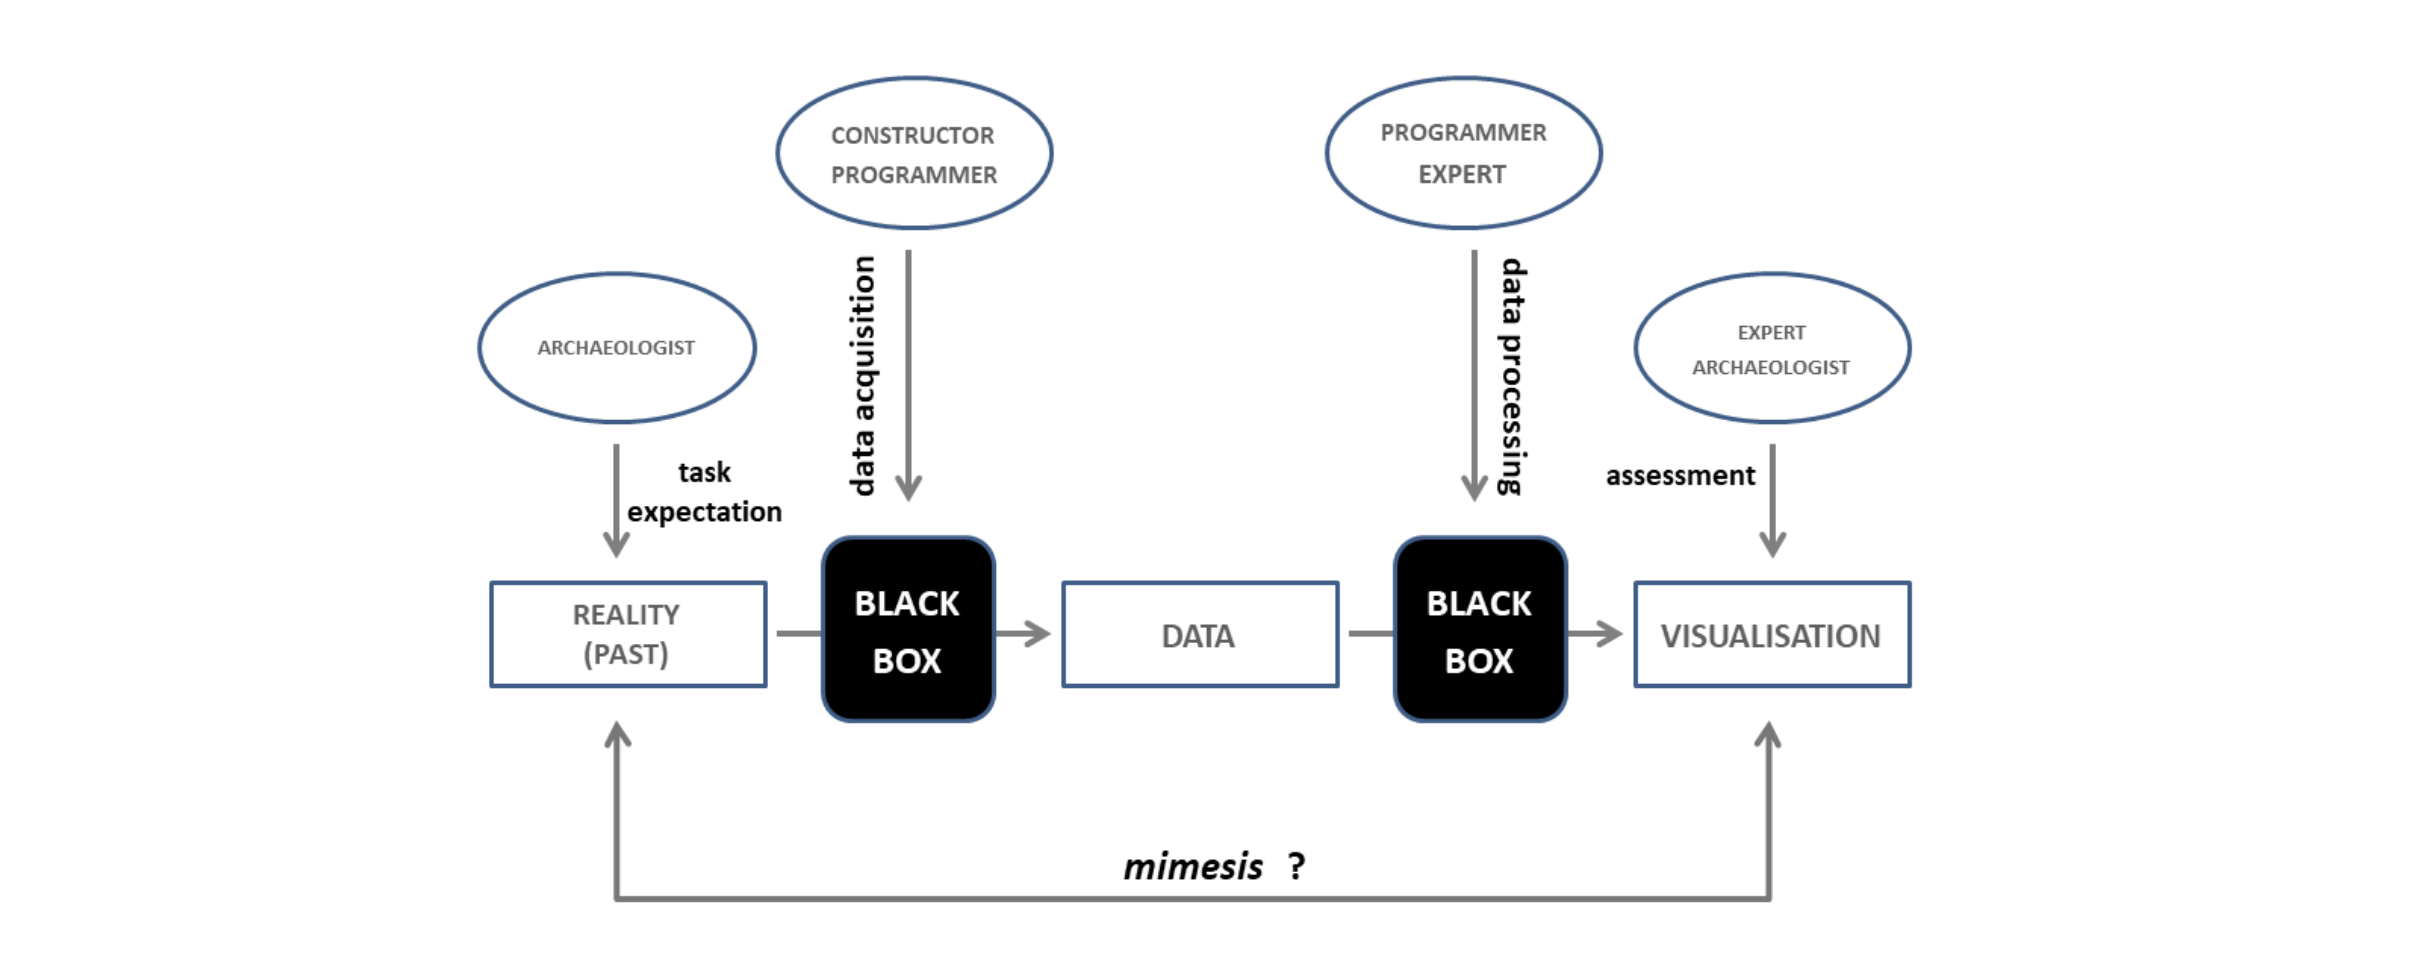
In his much-recommended article, Power and/or Penury of Visualisations, the Polish archaeologist, Włodzimierz Rączkowski, examines from a philosophical perspective several issues related to the new cognitive situation of archaeologists facing the development of new technologies within remote sensing. In this blog post, I want to refer to two practical issues that are raised. He asks himself whether archaeologists are aware of the data acquisition and processing processes and consequently of the degree of reduction, manipulation and modification that occurs throughout them. He recognises that between the formulation of the task – 3D datafication – and the final visualisation there are at least two black boxes representing the areas of intensive use of technology, in which processes and manipulations usually take place uncontrolled by the archaeologist, but usually recognised by remote sensing methods experts. He designed a graph to illustrate the procedure.

“The place of technology in the process of creating visualization as a form of knowledge about the past.” Indicating the process of 3D datafication for archaeology. Raczkowski 2020.
At the start of a 3D datafication, project the end-users (historians, museologists, archaeologists, …) raise certain expectations according to defined parameters. In a second step, data acquisition is executed based on those parameters. The acquisition plan is partly a product of the human mind including in general well thought out decisions but are also often subdued to (educated) guesses or assumptions. An example of this is the issue of “diffraction” in the process of image-based modelling. Most are aware of the relation between the aperture settings of the camera and the depth-of-field effect. But, the relation between the aperture settings, the issue of diffraction and its effects on modelling is less researched [Verhoeven 2019b]. Talking about the actual digital data acquisition we enter the first black box. Nowadays, it is almost exclusively computer-based, leaning therefore heavily on the work and role of constructors and programmers, which influences, e.g., in the spectral band of optical sensors. After the data is collected, we enter the second black box, processing the data in specifically designed software. Only a few (the programmers) are aware of the specific algorithms that are being used to develop the model. More people (information technology experts) are aware of the different settings that can be used, but one can question how well the end-users understand the effect and application of automated scripts such as colour classification, feature recognition or even interpolation. This leads us to the last step. Here, Rączkowski argues, that the expectations of the end-users will have an influence on the visualisations. Conditioned by cultural context, experience, knowledge, and expectations, the visualisation will be differently constructed.
These arguments in combination with the visualised process, invigorate the statement raised above that 3D datafication is not a digital replica. The digital surface model is at its best a digital approximation: a construct that is the result of many complex decision-making processes based on knowledge, technical capabilities, skills, goals, expectations, and awareness of research proceedings. Each of these processes should be stored within the Pure 3D platform in the form of metadata and paradata. After all, visualizations may be revised, changed, or modified at each stage of this process and in consequence even create new visualizations of the same real object [Tyleman 2018]. This also has a consequence to how 3D models should be used in research. End users should also be aware of the bias the models hold, for which in a research, the products of optical sensing techniques should always be combined with other surveying techniques and research methods – i.e. a holistic approach.
“The digital surface model is at its best a digital approximation: a construct that is the result of many complex decision-making processes based on knowledge, technical capabilities, skills, goals, expectations, and awareness of research proceedings.”
3. Direct vs indirect survey techniques
As a last issue, I want to address the undeniable tension between the goals of the Cultural Heritage field and the aims and strategies of the geomatics industry from which it borrows tools and practises. This tension comes from the inherent nature of these new optical sensing techniques and how it alters the cognitive aspect that is related to the survey of heritage. In the past, surveying was often defined as a practise in which: “The first objective of a survey should be to record what is necessary in order to understand and to illustrate the history of the building” (ICOMOS, 1990). A definition that was later paraphrased in the ICOMOS Sophia Principles for the recording of monuments, groups of buildings and sites (1996), and in the RecorDIM publications of the Getty Conservation Institute (Letellier, Schmid and Leblanc 2007). All these publications recognise that surveying is a cognitive process enabling the understanding of heritage. Adopting new techniques from the geomatics community has altered the aspect of “understanding”, because it changed the momentum of data selection [De Vos 2022, in press].
To explain this, first we need to look at the distinction between “direct” and “indirect” survey techniques. Under the name direct techniques we can group tools such as a Total Station (TS), hand-measured drawing, global navigation satellite systems (GNSS), etc. because interpretation and selection are actively made at the point of capture. They provide differentiated datasets relying on the surveyor understanding the extent and depiction of the subject to be mapped at the time of survey (Blake et al. s.d.). Indirect techniques, such as photogrammetry and 3D laser scanning are characterized by recording large amounts of undifferentiated data at the point of capture. Further processing and selection from that data, is done off-site (Blake et al. s.d.).
This distinction is an important one to make because it clearly explains the selection mechanism behind both techniques. However, when misinterpreted, it seems that when and where this selection finally is made is without consequence. In a recently published article the director of preservation studies at the Texas University, Brent Fortenberry, writes: “While the investigative component remains constant, digital technology moves the moment of documentation translation from the point of contact with the building into a third space—the studio or lab” (2019). This is not the case. Like I have argued above, the investigative component does not remain constant, because in most cases we are only investigating approximations of the surfaces – and not the objects itself.
Looking into the tradition of the German school of Building Archaeology, we see that surveying through close observation (in contrast to remote optical sensing) is much more than just a means of recording information, it is regarded as a research method as such (Busen et al. 2017). In fact their precursor Manfred Schuller is extremely critical towards the use of indirect measuring techniques to be applied for the metric survey of built heritage. He states that “the fundamental problem is that the analysis is separated from the object, so that one of the basic rules of building archaeology is not fulfilled” (2002). He warns that “this violation will take its revenge!”(ibid, 15). With the basic rule, he refers to his belief that “measuring and drawing must always take place on site in a combined process [as] only this approach sharpens the eye for critical observations and forces the mind to go to work.” (ibid, 11).
Personally, I plead for a holistic approach that combines the benefits of optical sensing techniques, with those of close observation and hand measurements (De Vos 2017). Although this seems all to obvious, in practise the use of combined methods are not a commonplace. We have reached a point in which we are travelling at two speeds. While not so long ago, surveying and research (understanding) was more or less interrelated, and thus taking place at the same speed, we now need to remind ourselves that although technology has offered a quick alternative – a price-affective and highly automated recording – the understanding of heritage and the creation of a comprehensive (historical) narrative does not come overnight. The two processes are detached and travel at a different speed. Although seductive we should be aware not to succumb to a prioritisation of digital 3D data acquisition over added heritage knowledge results. The use of technology should lead not so much to faster research but to better research.
Sources
Blake, B., Lunnon, S., Bedford, J., Andrews, D., Becket, N., Thomason, B., s.d. Metric Survey for Heritage Documentation, Documentation for Conservation, A manual for teaching Metric Survey Skills, English Heritage, Getty Conservation Institute [unpublished]. [online: http://bill-blake.co.uk/files/Download/CIPA%20Recordim%20Teaching%20Guide.pdf]
Busen, T., Knechtel, M., Knobling, C., Nagel, E., Schuller, M., Todt, B., 2017. Bauaufnahme, Munchen.
De Vos, P.J. 2017. “Documenting for Posterity: Advocating the Use of Advanced Recording Techniques for Documentation in the Field of Building Archaeology”. ISPRS Annals of Photogrammetry, Remote Sensing and Spatial Information Sciences, IV-2/W2, 59–65.
De Vos, P.J., 2022. “Reflection on the use of a Total Station and Hand-Measured Drawing for the Metric Survey of Built Heritage”; in:, B. Blake, M. Santana & A. Vandezande (ed.), 20 Years of Archdoc at the Raymond Lemaire International Centre for Conservation, Leiden [in press].
Fortenberry, B., 2019. “Digital Documentation in Historic Preservation Education and Research: Prospects and Perils”, Preservation Education & Research, 11, 81-116.
International Council on Monuments and Sites, 1996. Principles for the recording of monuments, groups of buildings and sites. Sofia. [online: https://www.icomos.org/en/charters-and-texts/179-articles-en-francais/ressources/charters-and-standards/387-principles-for-the-recording-of-monuments-groups-of-buildings-and-sites-1996]
International Council on Monuments and Sites, 1990. Metric Survey Guide to recording historic buildings, London.
Letellier, R., Schmid, W., & Leblanc, F., 2007. Recording, Documentation, and Information Management for the Conservation of Heritage Places: Guiding Principles. Los Angeles.
Rączkowski, Włodzimierz. 2020. “Power and/or Penury of Visualizations: Some Thoughts on Remote Sensing Data and Products in Archaeology”, Remote Sensing 12 (18): 2996.
Schuller, M., 2002. Building Archaeology, ICOMOS VII, Lipp GmbH, München.
The London charter for the computer-based visualisation of cultural heritage, 2009. [online: https://www.londoncharter.org/fileadmin/templates/main/docs/london_charter_2_1_en.pdf]
Tylman, W., 2018. “Computer Science and Philosophy: Did Plato Foresee Object-Oriented Programming?” Found. Sci., 23, 59–172.
Verhoeven, G., 2019a. “The 3D datafication of cultural heritage: more than just a flash in the pan?”, keynote presentation, at: The 27th CIPA Heritage Documentation international symposium “Documenting the past for a better future”, Avila.
Verhoeven, G., 2019b. “Resolving some spatial resolution issues – Part 2: When diffraction takes over”, AARGNEWS, 59, 12–23.


